Part 4 of Inspect the Web, a 6-part series. Previously: Forge the Web
In the last chapter, we saw how websites are conclusively delivering files to our computers. It’s not as if we open our browsers and we have a “window” to a web page; we have a real copy of the files that make up that web page and we can modify and read them as we like.
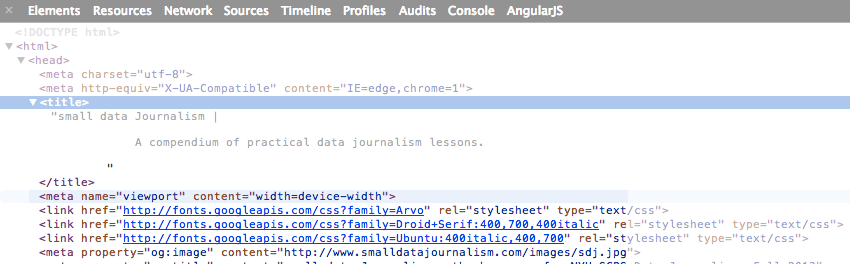
So how can we find out exactly what we’re downloading? Well, we can always view the source and check the HTML for references to external files:
However, that presents a few problems:
- It’s a pain in the ass to read source code.
- The HTML isn’t the only place where external files are referenced. For example, a CSS file may be used to define a
background-image, so you’d have to search through the source of all the HTML’s external files, too. - Even after a webpage is fully downloaded, it may contain code that triggers new downloads to a page. Think of the “(infinite scroll)[TK]” effect used at sites like Facebook and Pinterest.
Fortunately, the web inspector has something devoted to this: The Network Panel
Activating the Network Panel
First, close the Web inspector (or open a brand new browser window without the inspector open). Visit www.smalldatajournalism.com again.
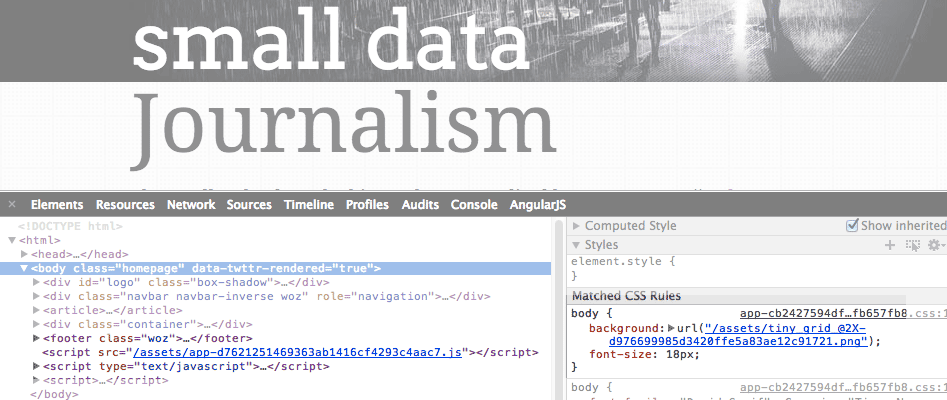
Now re-activate the Web inspector with the way we’re used to doing it: by inspecting an element on the page. The Elements panel will activate. But you should be able to see the names of all the inactive inspector panels, including Network:
Click on Network and you should see an empty panel and a message at the bottom that says:
No requests captured. Reload the page to see detailed information on the network activity.
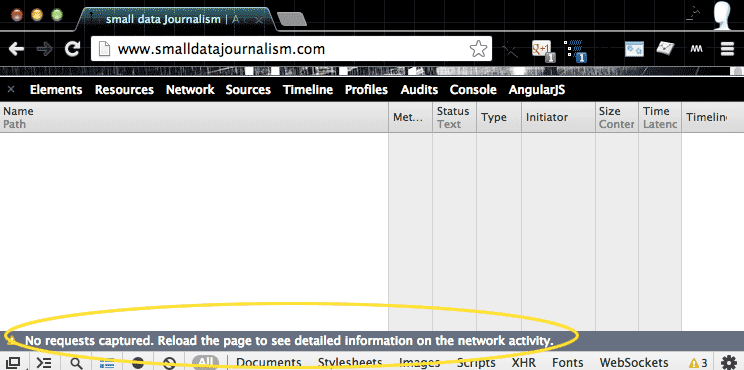
Apparently nothing is visible because the inspector wasn’t open when you visited (and then downloaded) www.smalldatajournalism.com.
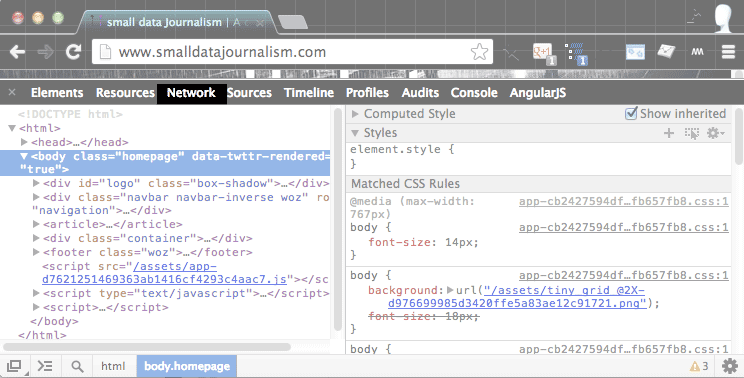
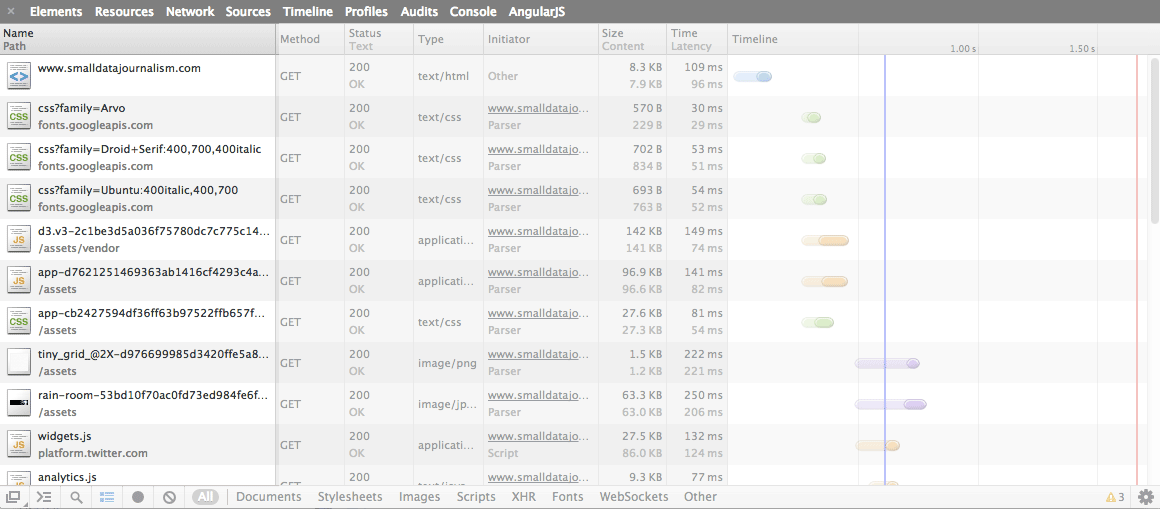
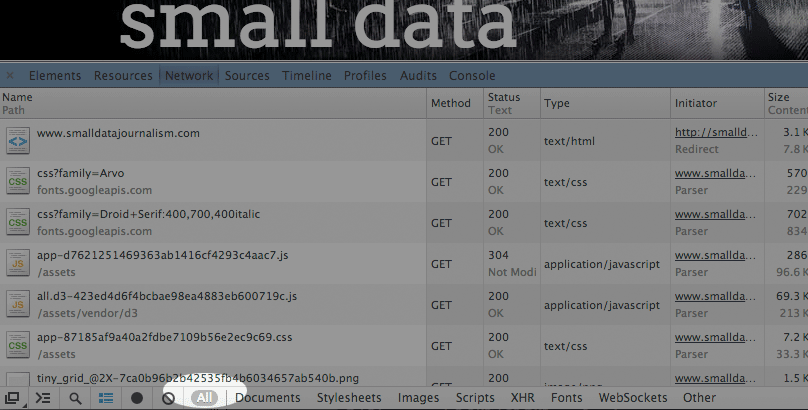
Now, reload the webpage with the Network panel still active. Now you’ll see some action:
Reload for real-time traffic
Before we look at the contents of the Network panel, I want to emphasize an important operational detail: while the Elements panel lets us examine and manipulate the HTML and CSS we’ve downloaded, the Network panel is a display of real-time traffic between your browser and the Internet.
Downloading HTML, CSS, and other files is a form of traffic. So if the Web inspector isn’t open while that traffic is taking place, then its Network panel will be empty.
So if you forget to have your inspector open before visiting a page, all you have to do is open the inspector and then reload the page, and the file transfers will be visible in the Network panel (even if the Network panel itself isn’t active).
Hard reload
If you visit a web page that you’ve visited before, your browser will often stash files – such as images and code files – onto your hard drive so that when you revisit the page, you don’t have to re-download those files.
This is a pretty useful feature to have, and you can see how (and when) it works with the Network panel. However, it can be confusing while we are learning about the Network panel and the traffic it sees.
To make sure you see roughly the same things I see in this chapter, do a hard reload when you reload a page. This can be done by holding down the Shift key while hitting the Reload button on the browser.
The keyboard shortcut for Chrome on Mac is to hit Cmd-Shift-R. For Chrome on Windows, do Ctrl-F5.
Navigating between the views
The Network panel has two subpanels: Table and Detail.
The tabular subpanel is what you see by default:
The detailed subpanel is what you’ll see if you click on any of the filenames in the lefthand side of the table:
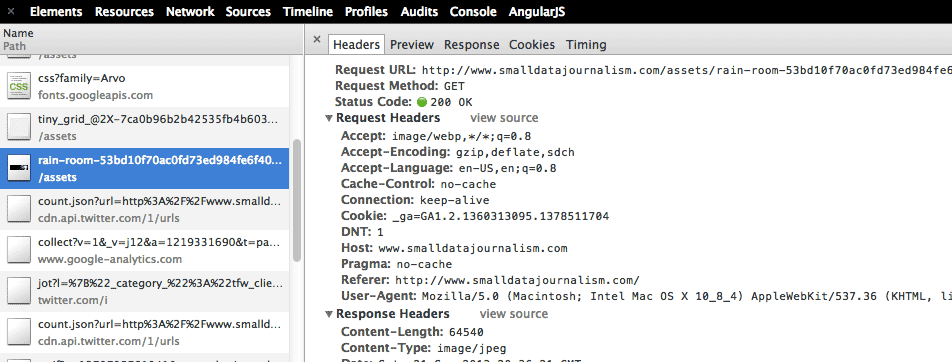
Note that this the detailed subpanel has its own subpanels, with Headers activated by default.
For this chapter, we’ll be looking at the Table subpanel and will cover the Detail subpanel in the next.
However, if you find yourself in the Detail view accidentally, click on the little x at the top to return to the Table view:
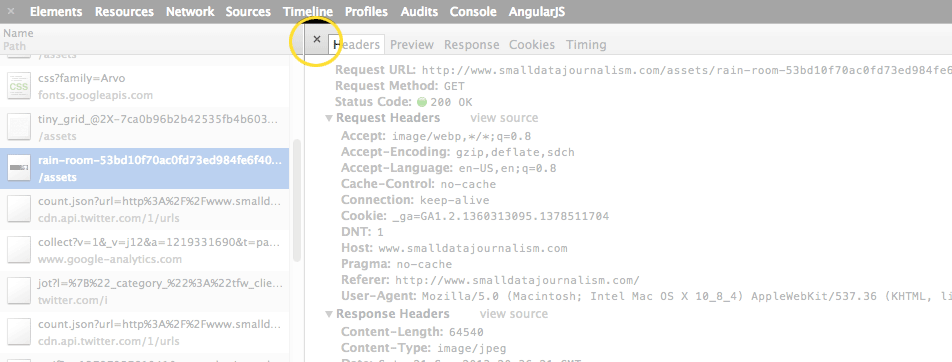
OK, so make sure you’re in the Table view before moving forward.
The Network Table
Each entry in the table is a file that has been downloaded (or sent, as we’ll see in the next lessons) from the Internet onto your computer. Besides the name of each file, the Network panel also tells us:
- The type of the file (HTML, CSS, images, movies, data)
- The size of the file
- When and how long it took to download the file
- Where the file came from
- And what triggered the file download.
The table has (at the time of writing) 8 columns and at any time you can resize the columns by clicking near their borders and dragging.
Let’s start with the left-most column: Name and Path
Name and path
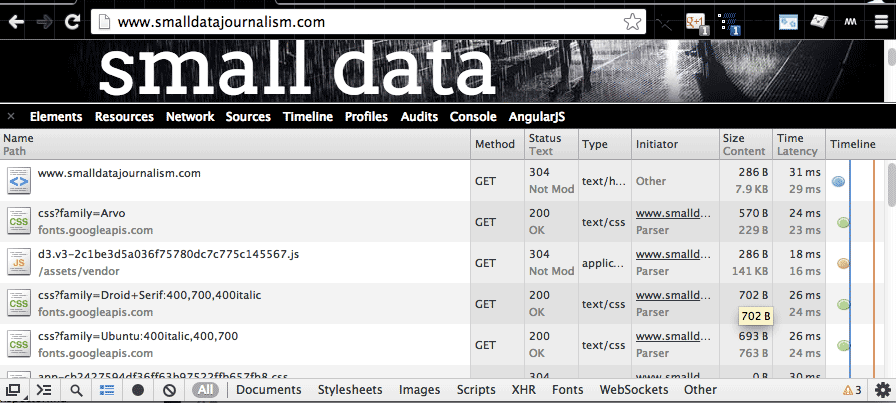
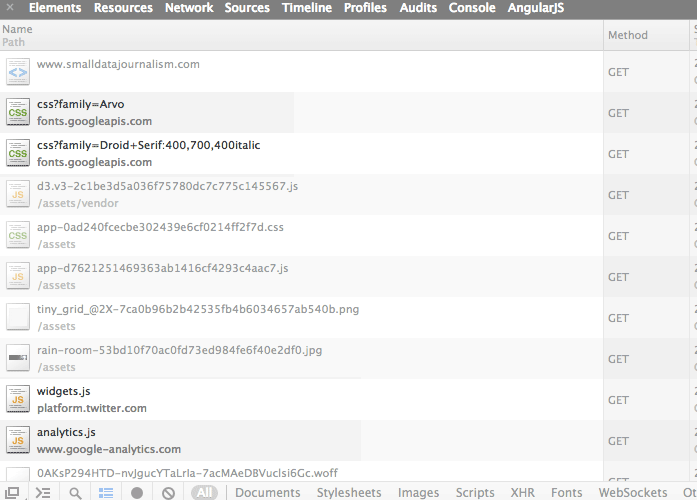
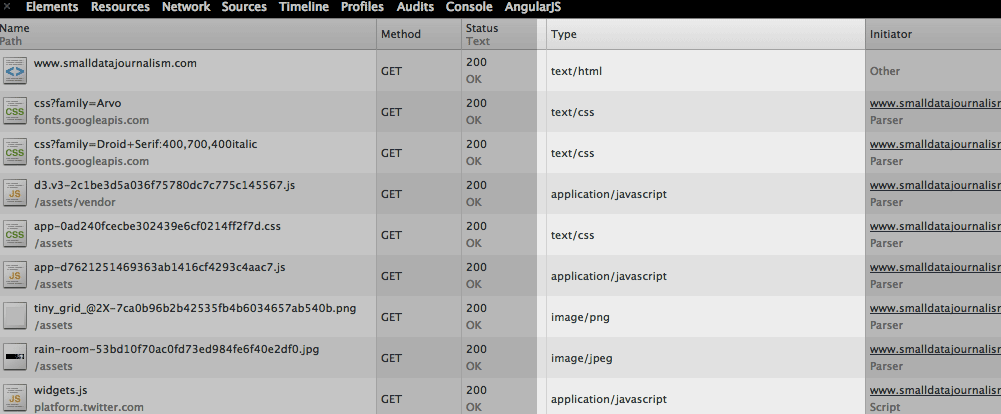
By default, the Network table lists the files in chronological order. The very first file is simply named www.smalldatajournalism.com and, as you might guess, it’s the HTML for for the webpage we directed our browsers to.
The next few files (if you did a hard reload) will be files that are necessary for the the styling of www.smalldatajournalism.com, such as the external fonts I use and the CSS files.
This makes sense if we look at the source HTML: those files are called at the very top of the HTML:
You’ll notice that each file entry actually has two lines. The first line is the purported name of the file, such as www.smalldatajournalism.com. But the second line is where the file came from.
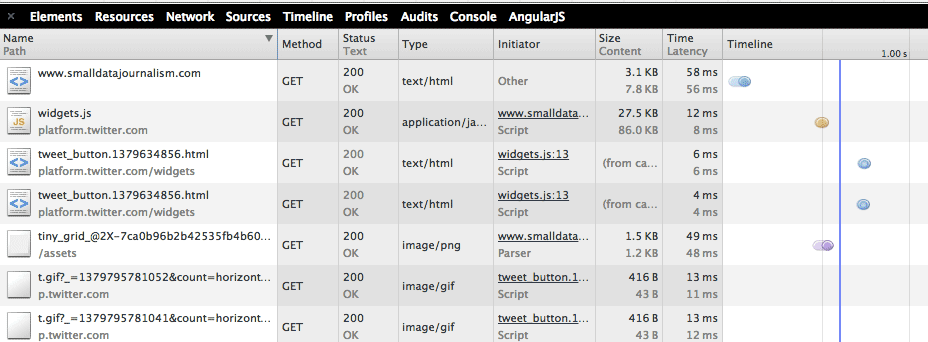
Now you might assume that every thing that makes up the www.smalldatajournalism.com homepage comes from, well, wherever www.smalldatajournalism.com is hosted. But in the Network panel, you should see a few entries in which the second lines refer to other sites. I’ve highlighted them in the image below:
With my mouse pointer, I’ve hovered over the widget.js file, which brings up a pop-up balloon:
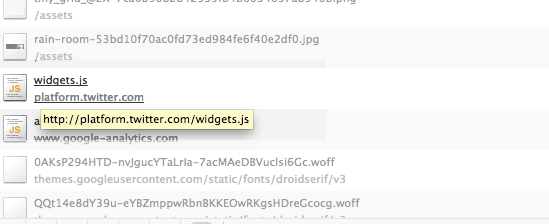
That pop-up balloon shows the file’s absolute location, i.e. its URL: http://platform.twitter.com/widgets.js
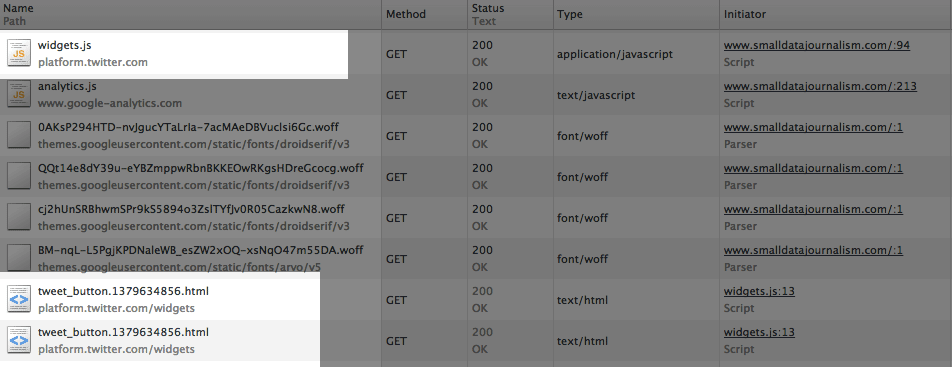
So it looks like the www.smalldatajournalism.com homepage is pulling in files from other sites. In fact, if you look down the file list, you should see at least a couple more files that come from platform.twitter.com named tweet_button:
Initiator
Well, I wrote all the HTML for the www.smalldatajournalism.com homepage, and I do remember making a call to platform.twitter.com/widgets.js. Here it is in the source code:
(This is a JavaScript snippet inside some HTML. Don’t worry about understanding it, just note the existence of //platform.twitter.com/widgets.js)
<script type="text/javascript">
  (function(){
    var twitterWidgets = document.createElement('script');
    twitterWidgets.type = 'text/javascript';
    twitterWidgets.async = true;
    twitterWidgets.src = '//platform.twitter.com/widgets.js';
    document.getElementsByTagName('head')[0].appendChild(twitterWidgets);
  })();
</script>
But I know I didn’t include a reference to any file named tweet_button. You can verify this for yourself by searching all my HTML source code (but you might as well take my word for it).
And yet, the network panel makes reference to a file named: platform.twitter.com/widgets/tweet_button.1379634856.html (it may be named slightly differently for you), so what’s going on?
Let’s turn our attention toward the right-half of the table, to the column named: Initiator.
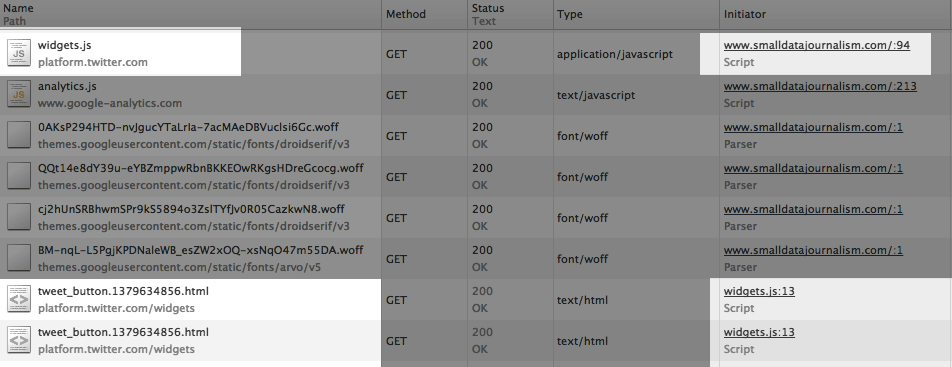
This column tells us what line of code told the browser to download a given file. Look at the Initiator for the file named widgets.js. It should say that it came from www.smalldatajournalism.com, just as I told you (the numbers at the end of the URL, e.g. :94, tell you want the line number of the code was, but we don’t need that detail right now).
So look at the Initiator for the file named tweet_button: you’ll see that the Initiator is: widgets.js
Aha! So this is the chain of events:
- My HTML code refers to
platform.twitter.com/widgets.js - That loaded
widgets.jsfromplatform.twitter.com - The
widgets.jsfile apparently makes a reference to a file namedplatform.twitter.com/widgets/tweet_button.1379634856.html - The
widgets.jsfile then downloads thattweet_buttonto my webpage.
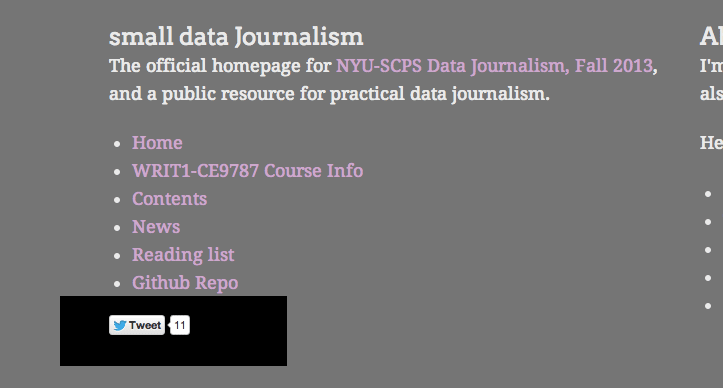
If you look in the footer of my website, you should see a little Twitter widget that looks something like this (unless my design changed drastically since I wrote this lesson):
File type
Now turn your attention to the column to the right of Initiator: its name is Type.
As we know by now, web pages consist of many different types of files. Usually, the filename’s extension – e.g. css – indicates what kind of file it is – e.g. text/css – but not always. And reading filename extensions is a pain anyway.
The Type column makes it easy to see the file types at a glance:
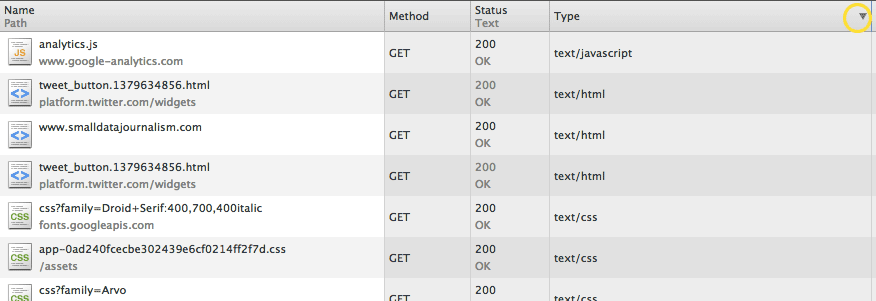
Try clicking on the column header – i.e. Type. This will sort the files by type, as opposed to the default chronological download order (you can sort by any column). Clicking on the Type header once should group the files by type, with application/javascript files at top:
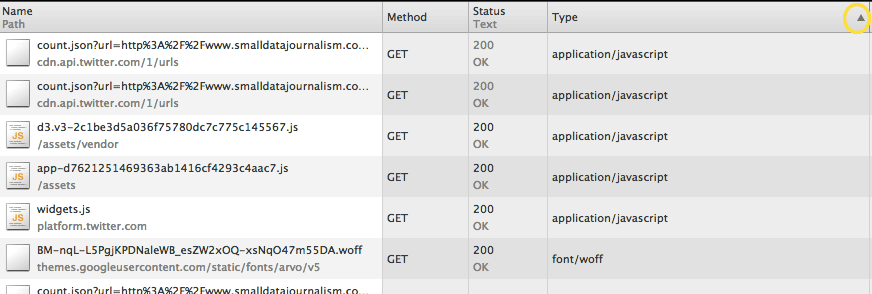
Clicking again will sort the types in reverse-alphabetical order:
Filtering by file type
Sometimes we only care about a certain file type, such as images. The Web inspector has a handy feature for filtering the list of files (which can be quite long on many websites) for a single type.
Look at the very bottom of the inspector window. There should be a list of terms, and one of them, All, should already be selected:
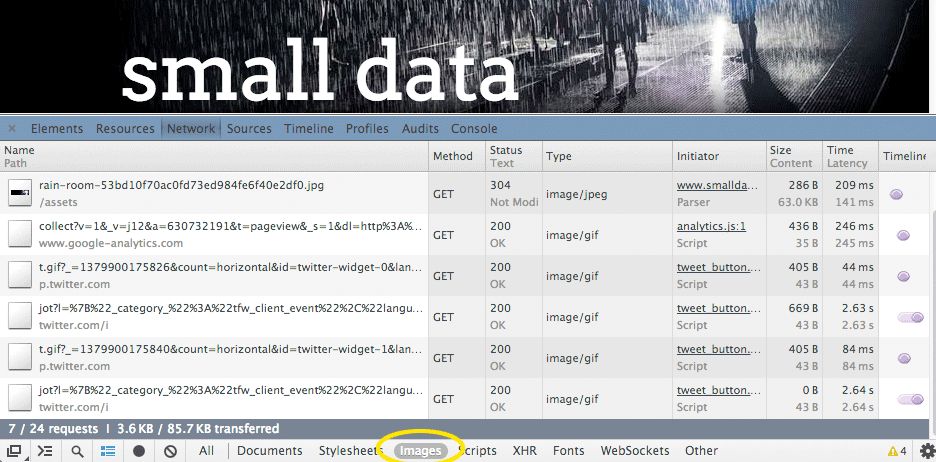
Click on Images and the list will show only image files:
Click All again to see the entire list of web files again.
Time and Size
The next two columns on the right are Time and Size, and they display, respectively, the number of milliseconds for the file to download and how big it was:
In the example above, the HTML file (but not its external files) for www.smalldatajournalism.com took roughly 71 milliseconds to get from wherever it exists on the Internet to being loaded into my browser. Not bad!
Both the Time and Size columns have a secondary number – Content and Latency, respectively – that offer more granular detail. But we don’t need to worry about those numbers now.
The rightmost column is the Timeline and serves as a visualization of when each file was successfully retrieved by the browser.
The speed of transfer isn’t a big deal for us in this lesson. However, how big the file is and when it was downloaded will be very useful for our purposes.
That’s it for now. In the next chapter, we’ll learn how to examine the files in detail from the network panel.
Exercises
Find the third animal
In a previous chapter, we found a cat and a dog photo. There’s a third animal photo in that chapter. Try to use the Network panel to find it.
Download an online video
Technically, when you watch a video on an online service, your browser is downloading the video data. So logically, there should be a URL that you can point your browser to. Use the Network panel to find the URL to the video below:
Answers
The third animal: Filter the Network panel by the Images file type. The third animal photo should stick out.
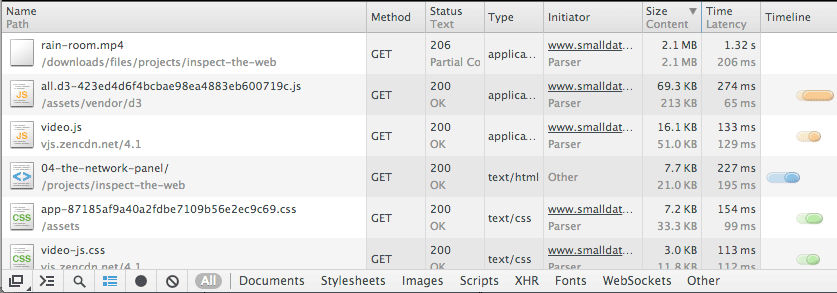
The video URL: As you might guess, the video file will be the largest file on this page. So sort the Network table by file size and the video URL should rise to the top.
Previous:
Forge the Web
Next:
Inspecting Data Files
Project Manifest
- Inspect the Web: How to see the underpinnings of the Web
- Meet the Web Inspector: How to find and activate the Web inspector
- Elements of the Web: Just text
- Forge the Web: Instant experimentation with HTML and CSS
- The Network Panel: See the traffic of the Internet
- Inspecting Data Files: The data is just text, too
- A Bit for a Bit: You don't get something for nothing.
- Inspect Everything: The Web is only the beginning